

The bottleneck isn’t the model.
Nearly every engineering team has the AI tools now. Almost none are shipping faster. This paper shows where the speed is leaking — and the 90-day, flow-first playbook that gets it back.
Written by Chris Sims · Managing Partner, Sigao
Where should we send your copy?
Why this paper, why now
The next wave of AI gains is 2–8× bigger — and it will skip the unprepared.
30–50%
lift in team productivity, from agents working in the background
By 2028 · up from 0–20% with today's code assistants
40%
of platform teams will use AI across every phase of delivery
By 2027 · up from <5% today
70%
of code vulnerabilities will be fixed by AI agents
By 2028 · up from 10% today
98%
of engineering teams have the AI tools. Barely half are shipping faster.
The tools aren't the difference. The delivery system around them is — and this paper is the playbook for building it.
Sigao · The Bottleneck Isn’t the Model
“The industry knew this playbook and set it aside in the AI gold rush, reverting to the oldest pattern in the book: buy the technology first, look at the system later.”
Projections: Gartner, “How to Maximize the Impact of Agentic AI in the SDLC” (2026). Survey figures: 2026 Gartner Software Engineering Survey · 2025 Gartner AI in Software Engineering Survey.
What the data shows.
+24%
more pull requests merged by engineers who adopted CLI coding agents in Microsoft's 2026 rollout. The task-layer gains are real — and they persist.
Microsoft study of its Claude Code & GitHub Copilot CLI rollout (2026)
3×
the probability of a production incident as task output soared — bugs per developer up 54%, review time up 91% on high-adoption teams.
Faros AI telemetry, 22,000 developers across 4,000+ teams (2026)
−7.2%
delivery stability per 25% rise in AI adoption — a negative stability relationship DORA observed again in its 2025 study of nearly 5,000 professionals.
DORA, State of DevOps (2024) · State of AI-assisted Software Development (2025)
95%
of enterprise GenAI pilots show no measurable P&L impact, across an estimated $30–40B in spend.
MIT Project NANDA, State of AI in Business (2025)
From the paper · Nº 01
Faster developers. Same release date.
The executive summary, reproduced in full.
Get the whitepaperSoftware organizations spent the last three years buying AI tools for individuals. The individuals got faster. Most delivery systems didn’t. The gap between those two sentences is where AI budgets go to die.
The evidence is no longer anecdotal. Adoption is near-universal and most developers report personal productivity gains — yet DORA’s research across thousands of teams has repeatedly associated rising AI adoption with worse delivery stability, and MIT’s 2025 State of AI in Business study found 95% of enterprise GenAI pilots produce no measurable P&L impact. The sharpest single result of the period: a randomized trial found experienced developers were 19% slower with AI assistance, even as they estimated they had been 20% faster.
The popular diagnosis is that the tools aren’t good enough yet. That story doesn’t survive contact with the data, because the same tools produce real system-level gains in a minority of organizations. What separates them isn’t the model — it’s where the acceleration got aimed: at a step, or at the system. Software delivery is a flow of work through stations and queues, and its speed is set by its slowest point. Accelerate any other point and you don’t get faster delivery. You get bigger piles.
Manufacturing learned this the expensive way in the 1980s, and left behind a mature, unglamorous toolkit for exactly this problem. The paper applies it to AI adoption in three moves, plus the loop that restarts them: map the delivery value stream, aim AI (and plain automation) at the constraint, manage the flow with lean tools — and re-map, because a fixed constraint doesn’t disappear. It moves, and your AI strategy has to move with it.
By the end you’ll have a way to find your constraint this month, a rule for where AI goes next, a 90-day arc for the first pass, and the metrics that survive a board meeting. None of it requires a transformation program. All of it requires giving up the most comfortable assumption in the industry right now: that buying speed for individuals is the same thing as building speed into a system.
A look inside
Ten sections between you and ready.
Those projections assume a delivery system that can absorb agentic capacity. The paper builds that system in three moves — map, aim, manage — and closes with the questions and metrics that tell you it’s working.
- Nº 01
Executive summary
The whole argument in a page.
- Nº 02
The illusion of speed
Two honest dashboards — task-layer gains, system-layer stalls — and the measured gap between felt and actual speed.
- Nº 03
We’ve seen this movie before
GM’s $45B robot program, NUMMI, and the thirty-year electrification lag: new power bolted onto old process.
- Nº 04
Move 1 — Map before you automate
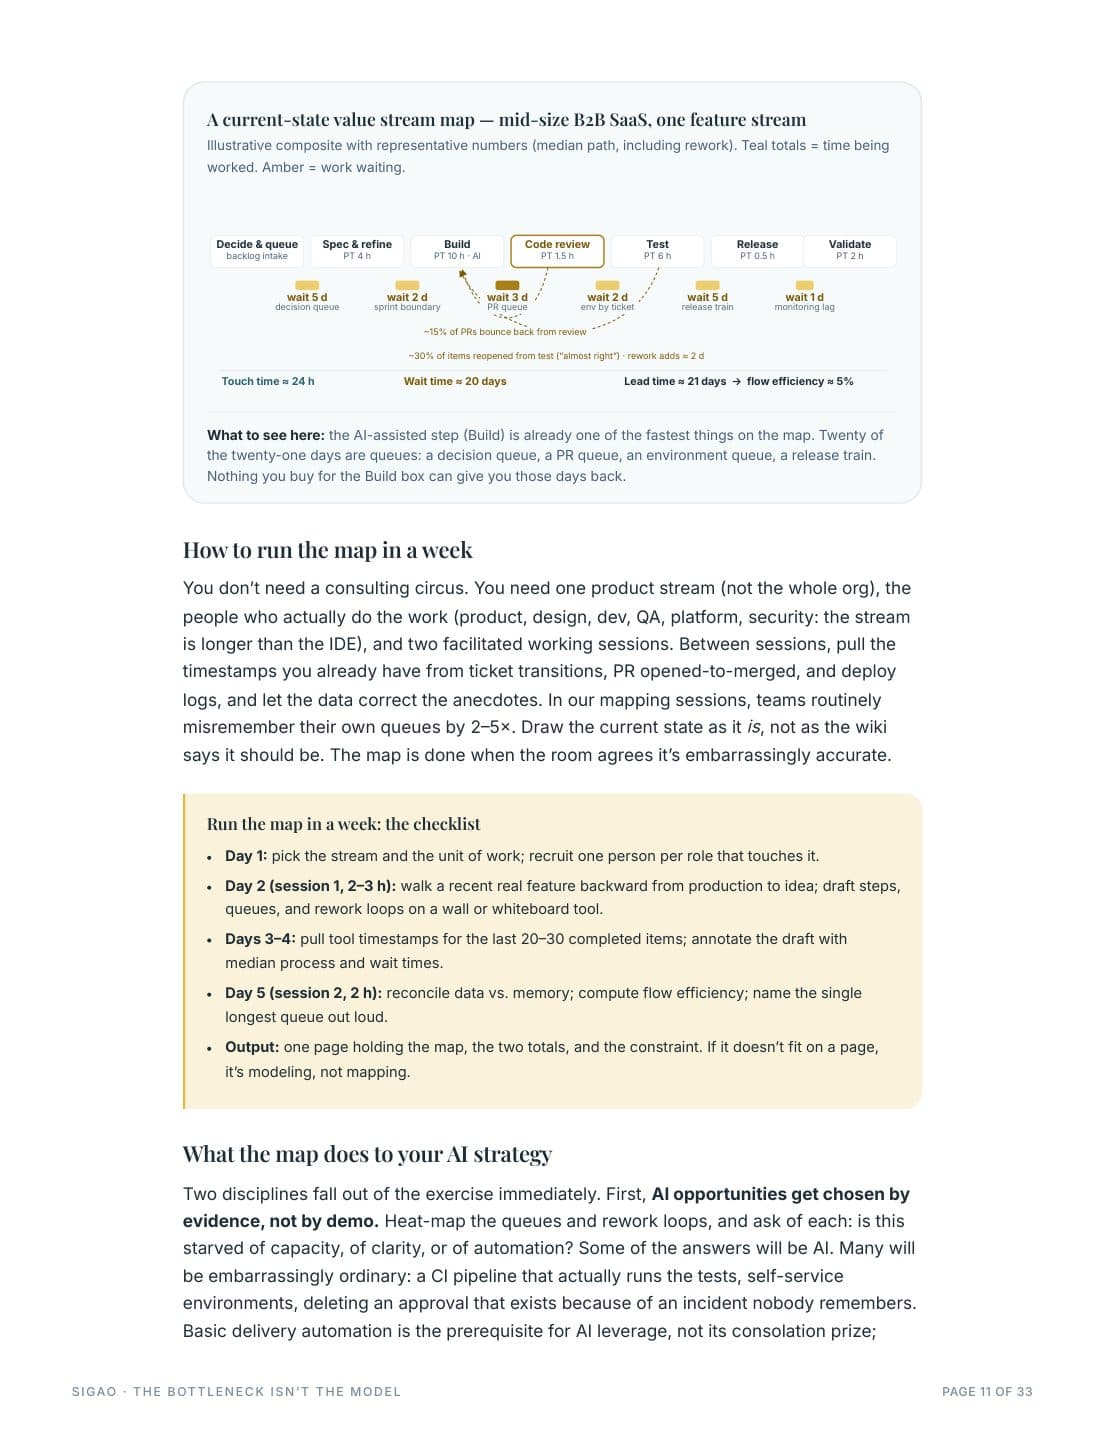
Value stream mapping in a week: find where work actually waits (it’s rarely where you think).
- Nº 05
Move 2 — Aim AI at the constraint
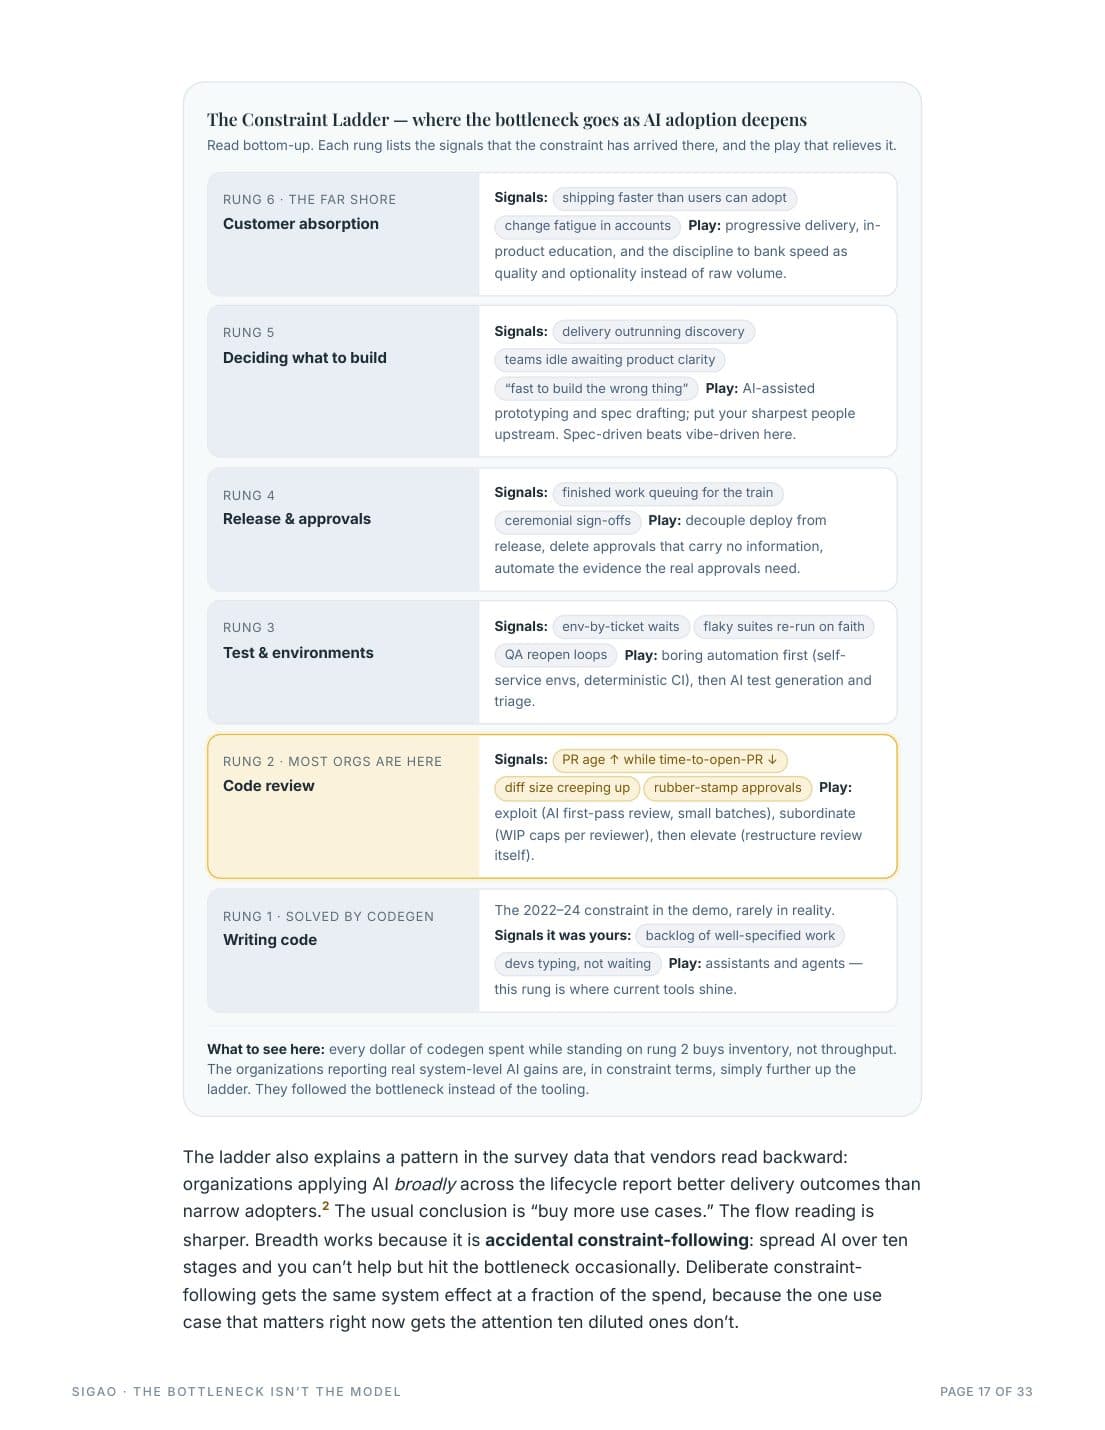
The Five Focusing Steps as an AI deployment algorithm, plus the Constraint Ladder.
- Nº 06
Move 3 — Manage the flow
WIP limits, small batches, and the lean toolkit — now applied to agents too.
- Nº 07
The 90-day playbook
Map, aim, manage: one value stream, ninety days, a before-and-after your board can read.
- Nº 08
Measure what the board can bank
Three layers of measurement, and the throughput-accounting scorecard that dismantles vanity ROI.
- Nº 09
The people system
Skeptics as an asset, roles that shift, and why respect for people makes the rest work.
- Nº 10
Your move
Ten questions to find your constraint this week.
The 90-day arc, in brief.
Nº 01Weeks 1–2
Map & baseline
Value-stream-map one product stream. Baseline the DORA four keys plus flow time, flow load, and flow efficiency — all from tools you already run — and pick the business number the stream feeds. Exit with one map, one baseline, one named constraint. No tooling decisions yet.
Nº 02Weeks 3–6
Exploit the constraint
Relieve the constraint with the cheapest adequate tool — often boring automation before any AI. Where AI genuinely fits the constraint, deploy it there first: review triage, test generation, spec drafting. Exit with one visible win, measured against the baseline — a moved number, not a pilot report.
Nº 03Weeks 7–12
Subordinate & systematize
Turn on the flow policies: WIP caps for humans and agents, batch-size ceilings, pull discipline. Pave the winning pattern into the platform, stand up the weekly flow review, then re-map — the constraint has moved. Exit with an operating rhythm your team runs without you.
Free · PDF · 33 pages
Sources & method
How this paper knows what it claims.
The paper synthesizes public research — the DORA reports, the MIT NANDA business study, the METR randomized controlled trial, 2026 large-scale telemetry and rollout studies (Faros AI; Microsoft), developer surveys, and the lean and Theory of Constraints literature — with Sigao's engagement experience applying value stream mapping and constraint management to AI adoption. The full 23-source bibliography, with per-claim citations, is in the PDF. The Gartner projections quoted above are strategic planning assumptions and survey results from Gartner's published research, cited with attribution; Gartner research is available to Gartner subscribers.
Limitations
Survey figures reflect their respondent populations, not the market as a whole. The operational numbers in the paper's value-stream figures are labeled illustrative composites, not client data. The METR result is specific to early-2025 tools in high-context settings and is cited as evidence about perception versus measurement, not as proof that AI slows all work. Projections are planning assumptions, not guarantees.
Written by Chris Sims, Managing Partner, Sigao — 25+ years building enterprise software and the delivery systems around it. Published August 2026.
References
- 01Gartner, “How to Maximize the Impact of Agentic AI in the SDLC” (2026)
Subscription research. The three projections above are its strategic planning assumptions.
- 02Gartner Software Engineering Survey (2026) and AI in Software Engineering Survey (2025)
Subscription research; source of the adoption-versus-delivery-speed figures.
- 03
- 04DORA, Accelerate State of DevOps Report (2024)
A 25% increase in AI adoption associated with −1.5% delivery throughput and −7.2% delivery stability.
- 05MIT Project NANDA, “The GenAI Divide: State of AI in Business 2025” (2025)
Directional finding, corroborated by the DORA results; its interview-based methodology has drawn critique.
- 06Microsoft, “Adoption and Impact of Command-Line AI Coding Agents” — the early-2026 Claude Code and GitHub Copilot CLI rollout (2026)
Tens of thousands of engineers over four months; adopters merged ~24% more pull requests.
- 07Faros AI, “Acceleration Whiplash” — telemetry across 22,000 developers and 4,000+ teams (2026)
Vendor telemetry rather than peer-reviewed research; cited for its scale and direction.
- 08
- 09METR, “Measuring the Impact of Early-2025 AI on Experienced Open-Source Developer Productivity” (2025)
Randomized controlled trial: 16 experienced maintainers, 246 real tasks; also at arXiv:2507.09089. Measures early-2025 tools — cited for the perception-versus-measurement gap, not as a current capability estimate.
- 10
- 11
- 12Goldratt & Cox, The Goal: A Process of Ongoing Improvement (1984)
The Theory of Constraints and the Five Focusing Steps.
- 13Rother & Shook, Learning to See: Value-Stream Mapping to Create Value and Eliminate Muda (1998)
- 14Reinertsen, The Principles of Product Development Flow (2009)
Queues as the dominant, invisible cost in product development.
- 15Forsgren, Humble & Kim, Accelerate (2018)
The DORA four key metrics and their link to organizational performance.
The full 23-source bibliography, with per-claim citations and methodology notes, is in the PDF.
Questions, answered
The questions this paper answers.
Short versions of the paper's core answers. The full argument — with the data, the figures, and the 90-day playbook — is in the PDF.
- Why isn’t AI making my team faster?
- Because your delivery speed is set by your slowest stage, and AI is almost certainly accelerating a different one. Individual gains become queued inventory at the bottleneck, typically code review, which is why adoption can rise while lead time doesn’t move. Map the stream, find the constraint, aim there.
- What is value stream mapping in software?
- A one-page drawing of every step a feature takes from idea to production, annotated with process time (being worked) and wait time (sitting in queues), plus rework loops. Its output is flow efficiency (touch time ÷ lead time) and the location of your longest queue. It takes about a week using timestamps from tools you already run.
- What is the Theory of Constraints in software delivery?
- Goldratt’s principle that, at any moment, one constraint sets a system’s throughput. Applied here: improvement at the constraint improves delivery; improvement elsewhere is a mirage. Its Five Focusing Steps (identify, exploit, subordinate, elevate, repeat) double as an AI deployment algorithm.
- Where should we apply AI first in the SDLC?
- At your current constraint: the stage with the longest queue on your value stream map. For most organizations right now that’s code review and verification, not code generation. If your constraint is deciding what to build, aim AI at prototyping and spec drafting instead of codegen.
- How do we measure AI ROI in engineering?
- Baseline first, then claim ROI only at the flow layer (lead time, deployment frequency, change-failure rate, flow efficiency) and business layer (time-to-market, cost per shipped feature), never from task metrics like acceptance rates or “hours saved.” A throughput-accounting check keeps it honest: did throughput rise, inventory fall, operating expense hold?
- Does this mean the AI tools are overhyped?
- The tools are genuinely powerful; the deployment doctrine around them is what’s broken. The same assistants that produce the adoption-up, delivery-flat paradox in a queue-blind organization produce compounding gains in a flow-managed one. The difference is the operating system, not the model.
After you read it
Put a number on it.
The paper ends with ten questions to find your constraint. The assessments pick up from there: benchmark your AI maturity, or model what your delivery system is really costing you.